GIS modeling in 2022, where to begin

January 28th, 2022
Kendall Frimodig
A brief history of the past 6 years
Around 6 years ago I began my journey in data analytics, as I enrolled in a two year masters program in Epidemiology. In retrospect this was rather poor timing; as I began my study in 2016 the field at large began to take off in a revolutionary way, and I was quite oblivious to these developments as I found my field of practice either insulated or resistant to such an overhaul.
Today I will focus primarily on providing cliff notes for someone undertaking their first geostatistical project today - but I must first defend my caveman like methods employed just 4 years ago, when I completed my first geospatial predictive model Here are a few illustrations of the developments taking place from 2016-2018.
- development of data science libraries take off
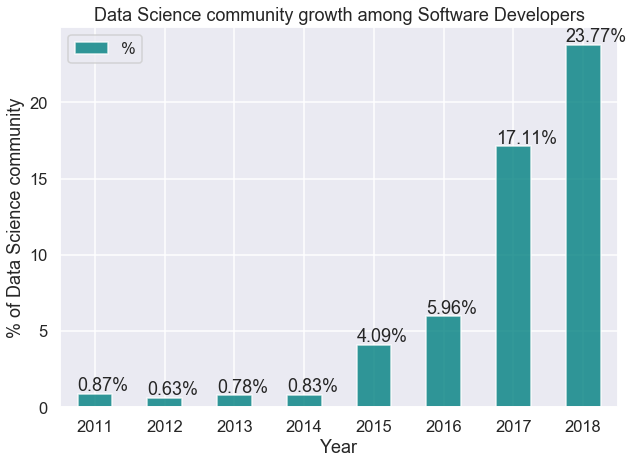
- the number of declared data science professionals double in my first year, and triple in my second year of school. source

- technical blog posting becomes saturated, to the point where there’s almost 10+ personal tutorials for a very specific API, python library, or GIS method I’m trying to understand. (not upset) source

- very high resolution satellite imagery becomes the norm (if you have the coin, source)

- satellites are deployed in droves source (mind the footnote!!)

With the pace we're seeing here, it will likely take some time for such changes to be reflected in textbooks. If you're working on a more advanced spatial regression problem, you might still want to crack open the textbook as there's many methods and associated parameters worth tuning. If you're looking to calculate a vegetative index, or classify land use characteristics, I have great news.
GIS in the cloud
In short, sophisticated data analysis including geospatial variants are simply more feasible in 2022. The bulk of my time spent on my first project involved the acquisition of orthoimagery, stitching of raster datasets, sampling and projecting to grids, and running local cluster analysis on such data. CPU time was certainly a limiting factor, with some functions running for up to 24 hours in ArcMap. As an example, if you wanted the best public imagery for a analysis of texas, this would amount to roughly 4 TB of data.
All of that pre-processing, and even modeling can now be done in the cloud! Sentinel-2 is currently the highest resolution, public satellite imagery source available (if time of image not as important, NAIP imagery is best as its taken from an airplane and 1m or lower resolution). Google earth engine is a repository for public and proprietary imagery, and an interactive application for suitable for most analysis.
Both have API's which can be called in a local python instance, and with a few days of study both can be queried to obtain model-ready raster data, without ever having to download raw imagery. For earth engine, you can actually apply simple calculations such as a NDVI or land type classification, with the javascript console or from python if you intend the results to be stored to be stored to google cloud storage.
Start your new project here, with the technical walk-throughs provided, and you will have far more time to invest in the creative and intellectually stimulating side of this work: solving the problem, visualizing the data, posing future questions for investigation.
Final Thoughts
The modern GIS workflow is highlighted by outsourcing storage and computational resources, applying neural networks for object classification, and leveraging imagery with higher spatial and temporal (detail, frequency of snapshots) resolution to tackle problems not imagined previously. Particularly, the reduced cost and software now available for DIY style drone based data collection has shown great promise - resolution of < 10 cm often.
With the marked increase in data-science libraries, enhancement of data collecting instruments, and ability to leverage cloud computing resources, one can breeze past the grueling pre-processing steps which were in the very recent past a standard.
Here are a few helpful tutorials for understanding earth observation (EO) data, sentinel hub, and google earth engine.
Introductions
-
Radiant Earth infographics, invaluable cheatsheats.. link
-
Guided jupyter tutorial for working with EO in python and scripting in earth engine.. link
Earth engine
-
Earth Engine 101.. link
- Earth Engine Tutorials and Documentation.. link
-
Workflow for using full google cloud stack for Earth Engine (with this, you could conduct a project from your phone!)..link
- Land type classification, from python using supervised classification.. link
Sentinel Hub